Complex Simplicity
Today, complex simplicity. The University of Houston's college of engineering presents this series about the machines that make our civilization run, and the people whose ingenuity created them.
We talk so much about simplifying. Finding the inherent simplicity in outwardly complicated things is an end we all seek. Einstein repeatedly talked about simplifying. In fact, he said, "A theory should be as simple as possible, but no more." Simplicity is also a central idea in Buddhism. Yet a peculiar catch lurks here.
Some ideas are intricate. Lesser people than Einstein have made Relativity Theory incomprehensible by side stepping its intuition-boggling nature. Take away that conceptual hurdle, and we'll never understand it. We have to negotiate the hurdle.
Take the much-used term, standard deviation. Fifty years ago, statistical ideas were in much less common use than they are now. When I first heard a statistician use the term in 1952, I asked what it meant. None of the words in his answer made sense. He said it was how far measurements scattered around an average value -- like the heights of ten-year-olds or salaries of secretaries.
So a standard deviation might be three inches or it might be two hundred dollars. And some children might be five inches less than the average -- some secretaries might make four hundred dollars more than the average. I heard the words, but didn't grasp the concept. I had yet to jump one large conceptual hurdle.
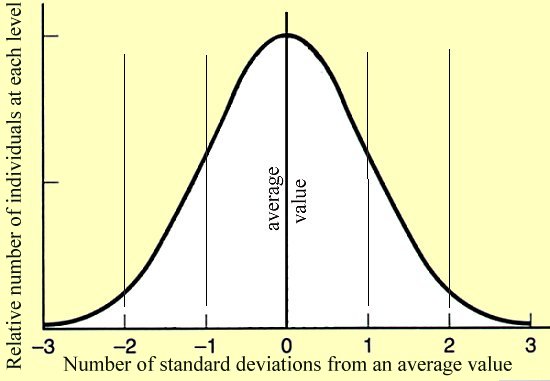
Let's see if we can make the jump: Imagine we divide our ten-year-olds into groups of each height -- four-feet-five inches, four-feet-six, and so forth. Plot these numbers of children against their heights, and (if we're dealing with large numbers) we get a bell-shaped curve. The curve peaks at the average, and it tails off (left and right) toward short or tall.
So we imagine a universal curve. Never mind whether it's plotted against inches or dollars; just think about its shape. Then imagine that curve to be cut into four vertical panels, with only five percent of the children -- or secretaries -- lying on each end of the curve, outside those four panels.
Each panel is one standard deviation. Why the curve is sliced just that way is a mathematical nicety, but the center two slices include about 68 percent of the children -- or of the secretaries.
The key feature here is adaptability. Consider eighty-pound bags of feed and eighty-pound fourth graders. One standard deviation might be fifteen pounds for the children and only four ounces for the bags. The weight of the bags is far more closely controlled. Being five pounds off the average means legal trouble for a grain dealer, but only a shrug from a parent. Now we have better means for assessing obesity or anorexia.
So here's one simple concept based on a subtle abstraction. Digest the abstraction, and the concept becomes a useful tool in daily life. Once we have it, we can treat scattered values of anything in the form of a universal curve. We can make far more intelligent comparisons of apples and oranges. Digest a bit of abstraction, and we, quite literally, become better citizens.
I'm John Lienhard, at the University of Houston, where we're interested in the way inventive minds work.
For the full story on the standard deviation and its use, see any introductory college textbook on statistics. The perfect Gaussian bell curve or normal distribution only occurs when variables are perfectly random. Normally they are not. That is no matter however, since the standard deviation can still be used to characterize the variability. Technically speaking, the standard deviation is the root mean square deviation of a variable from its average or mean value.
